The Trading Journal That Actually Works: Why P&L Tracking Isn't Enough
You've tried keeping a trading journal before. Date, instrument, P&L. It lasted two weeks. The problem wasn't discipline — it was what you were tracking.
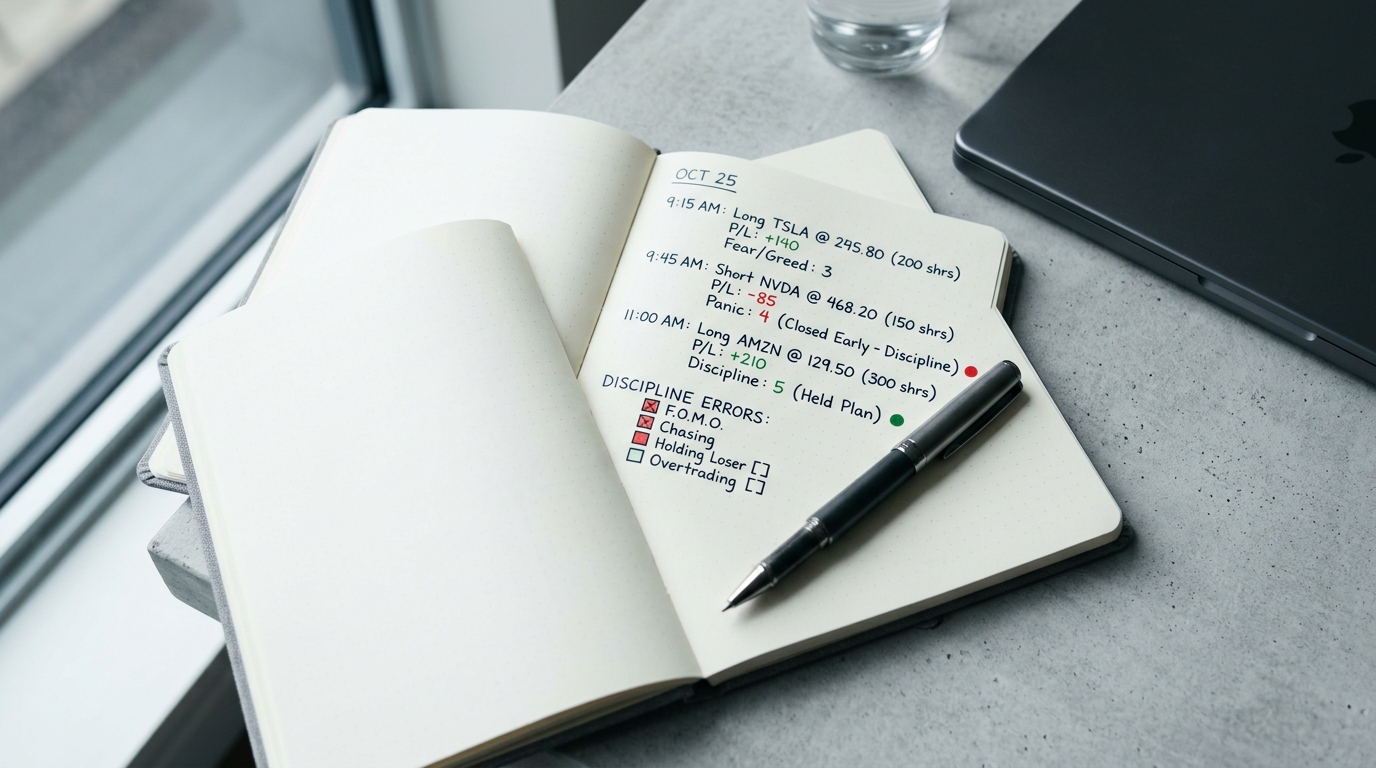
A trading journal is a diagnostic tool that records why trades happen, not just what happened. Most traders fail because they're tracking the wrong data — turning their journal into a useless logbook instead of a performance scalpel.
You've probably tried. Date, ticker, direction, entry, exit, P&L. Maybe a "notes" column that stayed empty after the first week.
Then you stopped. Not because you're lazy — because the journal wasn't telling you anything useful.
I went through the same cycle three times before I understood: the problem isn't discipline. The problem is what you're tracking. A journal that only records what happened is a logbook. A journal that records why it happened is a diagnostic tool. The difference between the two is the difference between repeating your mistakes and eliminating them.

Why Standard Trading Journals Fail
A typical trading journal tells you: "I lost $200 on a Gold short on Tuesday."
That's a fact. It's not an insight.
What actually helps: "I entered that Gold short while feeling anxious because I'd missed a move 30 minutes earlier. My emotional state was 7/10. I entered without my usual confirmation candle. I moved my stop once. This was a discipline error, not a strategy failure."
Same trade. Completely different information. One tells you the score. The other tells you why you're losing the game.
The 3-Layer Journal Method
The journal that transforms your trading has three layers. All three must be filled for every trade — no exceptions.
Layer 1: Trade Data (What Happened)
This is the standard stuff: date, session (London/New York), instrument, direction, entry price, stop loss, target, exit price, P&L in R-multiples.
Use R-multiples, not dollar amounts. If you risked $100 and made $250, that's +2.5R. If you risked $50 and lost $50, that's -1R. Dollars are misleading when your position size changes. R-multiples show your actual edge.
You need this layer, but it's the foundation — not the insight.
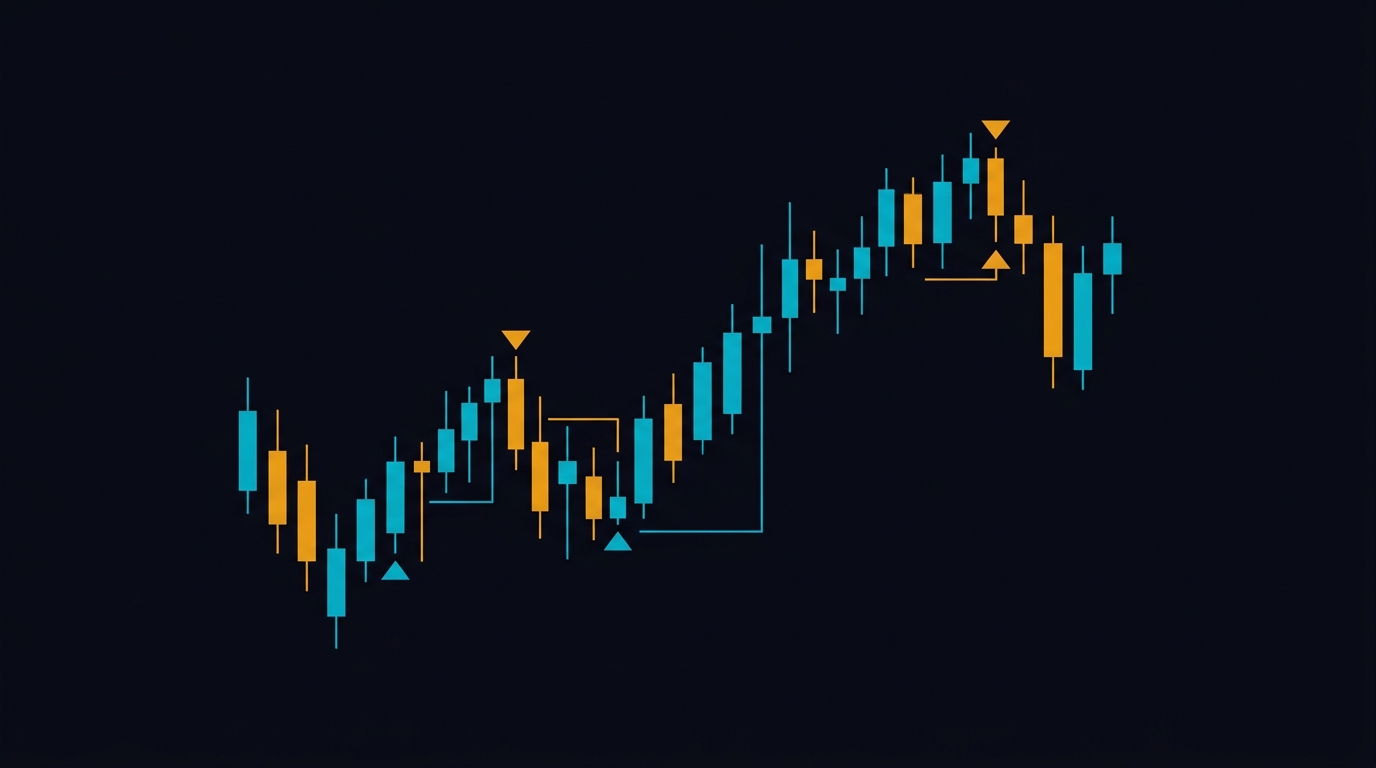
Layer 2: Process Data (What You Did)
For every trade, answer these questions honestly:
- Did I write a pre-trade plan before entering? Yes or no.
- Did the setup match all my entry criteria?
- Did I follow my entry model exactly or did I improvise?
- Did I respect my stop loss or did I move it?
- Did I take profit according to my rules or did I exit early/late based on emotion?
This layer reveals your discipline over time. After 50 trades, the patterns become undeniable. You'll see exactly where your execution breaks down — and it's usually in the same place every time.
Layer 3: Emotional Data (Why You Did It)
This is where it gets powerful.
Before every trade:
- Rate your emotional state 1-10 (1 = fully calm and professional, 10 = agitated)
- What triggered the decision? (Setup appeared naturally on chart vs. "I felt like I needed to trade")
- Any physical sensations? (Tension in shoulders, urgency in stomach, racing heart)
After every trade:
- How do you feel about the outcome — separate from P&L?
- If it was a loss: good loss or discipline error? (More on this below)
- What would you do differently?
Like an airplane's black box, this emotional layer records everything — especially the data you need most when something goes wrong.
The Distinction That Changes Everything
After building my own journal system, I discovered one classification that had more impact on my trading than any strategy change: the difference between a good loss and a discipline error.
Good loss: You followed your trading plan to the letter. Valid setup, calculated position size, stop loss respected, the market moved against you. This is the cost of doing business. A restaurant accounts for spoiled inventory. You account for stopped-out trades. Nothing to fix.
Discipline error: You deviated from your process. Entered without a pre-trade plan. Moved your stop loss. Doubled your size to recover. Traded outside your session. Ignored your circuit breaker. Here, the strategy isn't broken — your behavior is.
Confusing these two categories is the fastest way to sabotage your own growth:
- Treating good losses as failures leads you to modify a strategy that's actually working
- Treating discipline errors as "bad luck" means you never address the real problem
Every losing trade in your journal should be classified as one or the other. At month end, count them. Your target isn't zero losses — it's zero discipline errors.
The Patterns You Can't See Without Data
After 30-50 trades with all three layers, patterns emerge that are invisible in real time. Real examples from traders who tracked properly:
- "My win rate drops dramatically after 3pm." Decision fatigue is measurable. The last trades of the session are consistently the worst.
- "I lose money when my pre-trade emotional state is above 6." The correlation between emotional state and trade quality becomes undeniable when you have the data.
- "My revenge trades have a 20% win rate. My planned trades have a 55% win rate." Obvious in data. Invisible in the moment.
- "I'm profitable on Monday through Wednesday and unprofitable Thursday and Friday." Fatigue accumulation across the week, visible only in aggregate.
These aren't hypothetical. These are real patterns that real traders discovered only because they tracked the right data.
The Weekly Review: 30 Minutes That Compound
The journal captures data. The weekly review creates insight.
Every Saturday — or whenever your trading week ends — spend 30 minutes reviewing:
- Total trades taken vs. trades that met all entry criteria
- Win rate on planned trades vs. impulse trades
- Average emotional state on winners vs. losers
- Number of discipline errors and what triggered each one
- One behavioral pattern you noticed this week
- One concrete, specific adjustment for next week
This review is more valuable than any indicator or webinar. It's customized to your weaknesses because it comes from your own data.
Spreadsheets vs. Purpose-Built Tools
Can you do this in Excel or Google Sheets? Technically, yes. Many traders start there, and if a spreadsheet keeps you journaling consistently, use it.
But spreadsheets have real limitations for this kind of analysis:
- No automatic correlation between emotional state and trade outcomes
- Manual calculation of everything
- High friction discourages consistent entries
- No pattern recognition over time unless you build complex formulas
The best trading journal is the one you actually fill out every day. If you've tried spreadsheets and stopped after two weeks, the friction of the tool was probably the bottleneck — not your discipline.
Purpose-built platforms that integrate emotional tracking with trade data, calculate correlations automatically, and surface behavioral patterns through analysis compress months of manual work into days.

Key takeaways
- Track all three layers for every trade: what happened, what you did, and why you did it
- Classify every loss as either a good loss or discipline error — your target is zero discipline errors, not zero losses
- Spend 30 minutes every Saturday reviewing patterns in your data
- The journal that works is the one you actually use — choose tools that reduce friction, not increase it
- Real behavioral patterns only emerge after 30-50 trades of consistent tracking
---
TradingMindLab integrates emotional tracking directly into every trade — pre-trade state, during, and post-trade. The platform correlates your emotions with outcomes automatically and generates a personal weekly AI report analyzing your behavioral patterns. No spreadsheets. No manual formulas. Just the data that actually changes your trading.