Monte Carlo Simulation Day Trading Risk Management
Most day traders use basic win rates to calculate risk, but that's like driving at night with broken headlights. Monte Carlo simulation shows you the real probability distribution of your trading outcomes.

Monte Carlo simulation for day trading risk management 2026 is a statistical method that runs thousands of random trade sequences using your historical performance data to reveal the true probability distribution of future outcomes. Instead of relying on basic win rates that show only average performance, this approach reveals the realistic range of drawdowns and profit scenarios you'll actually face.
I learned this the hard way in 2022 when a seemingly "safe" Gold strategy with a 65% win rate nearly blew my account during an unexpected losing streak. The math said I was fine. Reality disagreed.
What Monte Carlo Simulation Actually Does for Day Traders
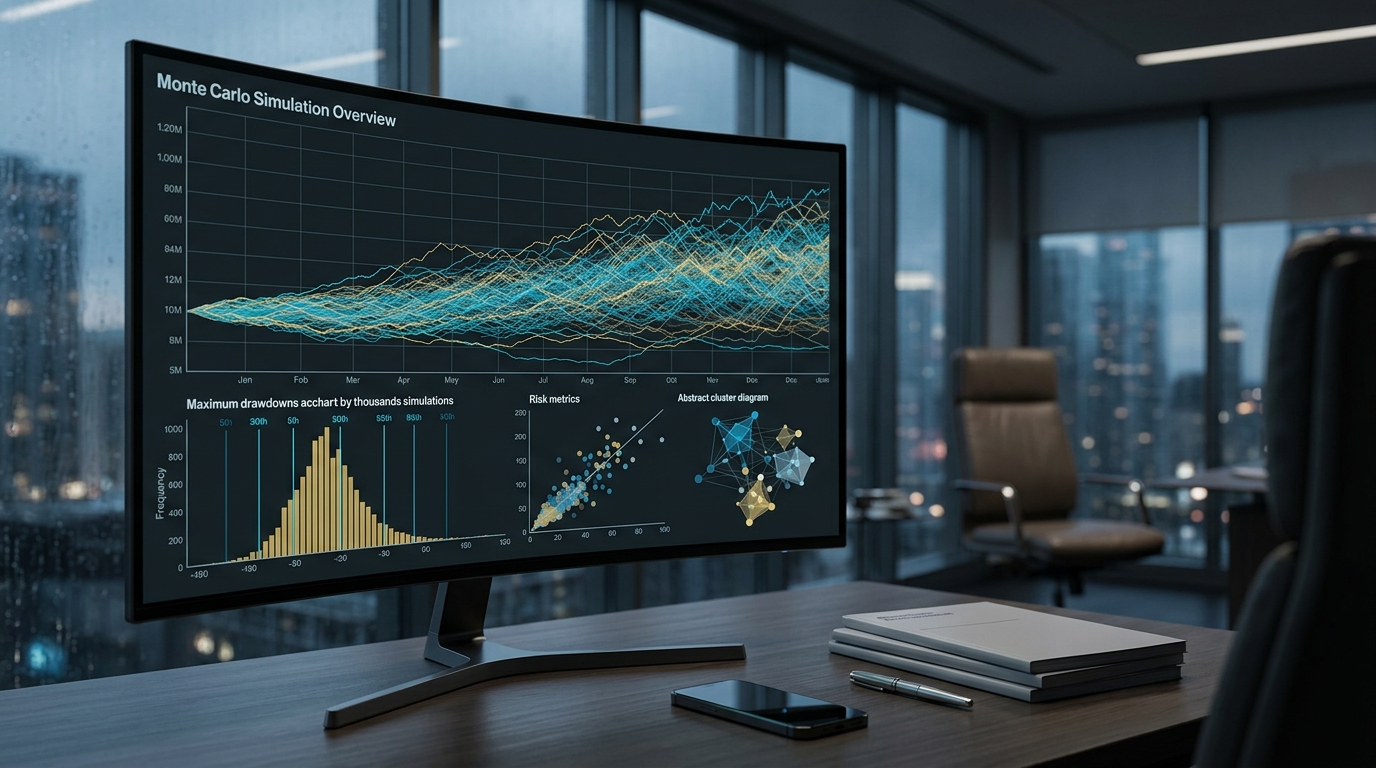
Monte Carlo simulation takes your historical trading performance and runs it through thousands of random sequences. Instead of assuming your trades will happen in the exact same order they did historically, it scrambles them — because that's closer to what actually happens in live markets.
Here's the brutal truth: your 60% win rate doesn't mean you'll win 6 out of every 10 trades in sequence. You might lose 8 in a row, then win 12 out of 15. Monte Carlo shows you these realistic scenarios.
Take my recent 300 trades with a 60% win rate and total P&L of $13,378.84. On the surface, that looks solid. But when I run Monte Carlo analysis on this data, I see potential drawdowns that would make most traders quit — even with profitable overall performance.
The Statistics Most Day Traders Get Wrong
The biggest mistake I see (and made myself) is confusing average performance with probable outcomes. Your trading journal might show:
- Average win: $120
- Average loss: $80
- Win rate: 60%
- Expected value per trade: $40
But these averages hide the distribution. Maybe your wins cluster around $50-$150, but you have occasional $500 winners that skew the average. Your losses might be consistently $80, or you might have rare $300 disasters.
Real Example: Nasdaq Futures Risk Distribution
Last month I tracked 47 NQ trades with these results:
- 28 winners (59.6%)
- 19 losers (40.4%)
- Largest win: $340
- Largest loss: $165
- Net P&L: $1,247
Looks good, right? But Monte Carlo simulation revealed that in 15% of scenarios, this exact same trade distribution could result in drawdowns exceeding $2,000. The sequence matters more than the individual results.
Building Your Monte Carlo Model
You don't need a PhD in statistics, but you do need clean data. This is where manual trade logging becomes crucial — and why I built TradingMindLab's detailed entry system. You need:
Core Data Requirements
- Individual P&L for each trade (not just daily totals)
- Entry and exit prices
- Trade duration
- Market conditions (trending, ranging, volatile)
- Your emotional state (this affects trade selection)
The Simulation Process
1. Extract your trade P&L sequence: [-$80, +$45, +$120, -$65, +$200, -$90...] 2. Run random sampling: Create 10,000 different sequences using your actual results 3. Calculate running equity: Track account balance through each simulated sequence 4. Analyze distributions: Look at percentile outcomes, maximum drawdowns, time to recovery
What the Numbers Actually Tell You
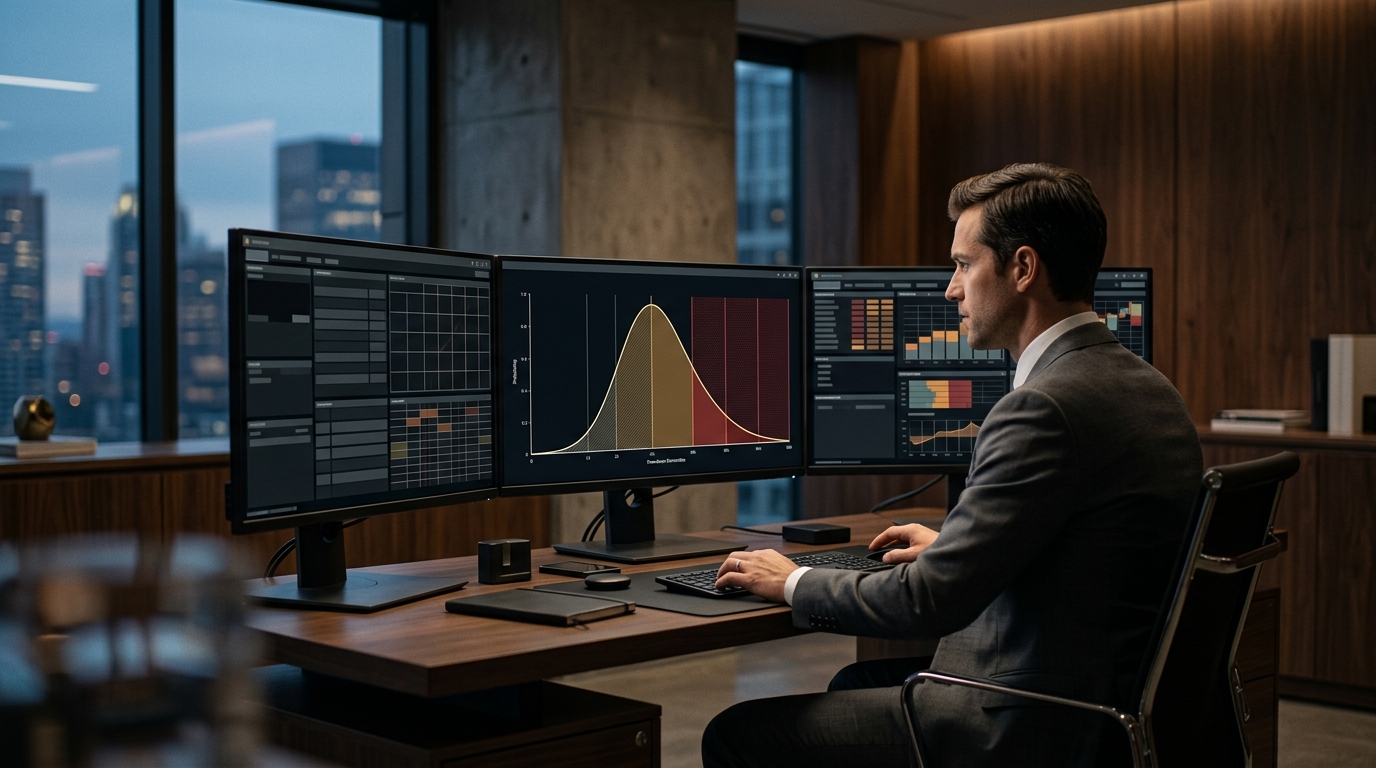
Monte Carlo doesn't predict the future — it shows you the range of possibilities based on your demonstrated performance. From my 300-trade dataset, here's what I learned:
Drawdown Reality Check
Even with a 60% win rate and positive expectancy, Monte Carlo showed:
- 50th percentile max drawdown: $1,240
- 90th percentile max drawdown: $2,890
- 99th percentile max drawdown: $4,350
That 99th percentile number? That's what could happen 1 in 100 times with this exact performance profile. Are you capitalized for it?
Sequence Risk in Gold Trading
Gold markets can be streaky — trends persist longer than most traders expect. I've seen my Gold strategy produce 12 consecutive losers during ranging markets, even though it averages 58% winners annually.
Monte Carlo simulation revealed that sequences of 8+ consecutive losses happen in 23% of scenarios over 200 trades. Without this analysis, I would have abandoned a profitable strategy during normal statistical variance.
Position Sizing Based on Monte Carlo Results
Traditional Position Sizing Problems
Most traders use fixed percentage risk (like 1% per trade) or Kelly Criterion based on average win/loss ratios. But these methods assume normal distributions and consistent performance.
Monte Carlo shows you the actual distribution, which is usually far from normal. Your position sizing needs to account for:
- Clustering of losses (bad sequences happen)
- Tail risk (those rare but devastating outcomes)
- Time-based risk (how long you might stay underwater)
| Position Sizing Method | Assumes Normal Distribution | Accounts for Sequence Risk | Handles Tail Events | Implementation Difficulty |
|---|---|---|---|---|
| Fixed % Risk | Yes | No | No | Easy |
| Kelly Criterion | Yes | No | Partially | Medium |
| Monte Carlo Adjusted | No | Yes | Yes | Hard |
| Dynamic Monte Carlo | No | Yes | Yes | Expert |
Dynamic Risk Adjustment
After running Monte Carlo on my Gold day trading results, I implemented dynamic position sizing:
- Base size: 0.8% risk per trade
- After 4 consecutive losses: reduce to 0.6%
- After 6 consecutive losses: reduce to 0.4%
- After any 10% drawdown: halt trading for analysis
This approach, informed by Monte Carlo probabilities, has kept me trading through statistical rough patches that would have blown previous accounts.
Implementation Tools and Workflow
Software Options
You can run Monte Carlo analysis in:
- Excel/Google Sheets (basic but functional)
- Python with NumPy/Pandas (more sophisticated)
- R for advanced statistical analysis
- Specialized trading software
I integrated Monte Carlo capabilities into TradingMindLab because most traders won't maintain separate analysis tools. When you're logging trades with emotional context, running the risk simulation should be one click away.
Monthly Analysis Routine
I run Monte Carlo analysis monthly on my trading data:
1. Export last 100-200 trades 2. Run 10,000 simulations 3. Update position sizing rules 4. Adjust stop-loss protocols 5. Recalculate required capital
Real-Time Risk Monitoring
During live trading, I track where I am relative to Monte Carlo percentiles:
- Green zone: performing within 25th-75th percentile
- Yellow zone: 10th-25th or 75th-90th percentile (review strategy)
- Red zone: below 10th or above 90th percentile (investigate immediately)

The Psychology Factor Most Models Miss
Here's where Monte Carlo simulation gets tricky: it assumes you'll continue trading the same way regardless of results. But humans don't work like that.
After 5 straight losses, do you:
- Take the next setup with full size?
- Skip marginal setups?
- Overtrade to "get even"?
- Quit for the day?
Your emotional responses aren't random — they follow patterns. This is why TradingMindLab emphasizes emotional state tracking alongside P&L. Your Monte Carlo model should account for how drawdowns affect your execution.
Behavioral Adjustments
I've learned to modify Monte Carlo assumptions based on my psychological patterns:
- After 3 losses, my setup selection becomes more conservative (affects win rate)
- During drawdowns >5%, I reduce size anyway (affects P&L distribution)
- In strong trending markets, I take larger size (changes risk profile)
Common Monte Carlo Mistakes
Using Too Little Data
Don't run Monte Carlo on 30 trades. You need at least 100 meaningful trades, preferably 200+. With insufficient data, you're just generating random numbers.
Ignoring Market Regime Changes
Your 2025 trading performance might not apply to 2026 markets. I separate my analysis by:
- Market volatility levels (VIX ranges)
- Trending vs. ranging conditions
- High vs. low volume periods
Over-Optimizing Based on Simulations
Monte Carlo shows probabilities, not certainties. Don't change your entire strategy because one simulation run looked bad. Use it for risk management, not strategy selection.
Frequently asked questions
How many trades do I need before Monte Carlo becomes reliable?
You need minimum 100 trades, preferably 200+ for meaningful results. With fewer trades, you're extrapolating from insufficient data and the simulation outputs become unreliable. Start collecting clean trade data now — it takes 2-3 months of consistent trading to build a useful dataset.
Can Monte Carlo simulation predict my future trading performance?
No, Monte Carlo doesn't predict future performance — it shows the range of possible outcomes based on your historical results. It assumes your edge and execution remain consistent, which may not hold true as markets evolve or your skills improve.
Should I adjust position size based on Monte Carlo worst-case scenarios?
Yes, but don't size for the absolute worst case (99th percentile) or you'll trade too small to be profitable. Size for scenarios you can psychologically handle — typically 80th-90th percentile drawdowns depending on your risk tolerance.
How often should I update my Monte Carlo analysis?
Run new simulations monthly using your most recent 150-200 trades. Your performance profile changes over time as you improve, so outdated simulations can give false confidence or unnecessary fear about current risk levels.
Key takeaways
- Run Monte Carlo simulations on minimum 100 trades to see realistic drawdown scenarios your basic win-rate math completely misses
- Size positions for 80th-90th percentile drawdown outcomes, not average performance, because sequence risk creates far worse scenarios than most traders expect
- Implement dynamic risk reduction rules triggered by consecutive losses, since Monte Carlo reveals that 8+ losing streaks happen in 23% of scenarios
- Update your simulations monthly with recent trade data because your performance profile evolves and old data becomes irrelevant for current risk assessment
- Account for psychological factors in your model since Monte Carlo assumes consistent execution, but real traders change behavior during drawdowns